![]()
How good are Perrin's measurements?
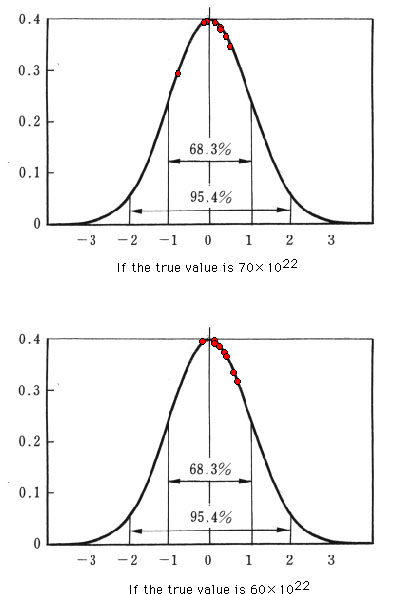
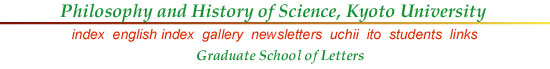
Perrin's measurements of the Avogadro Number by means of translatory displacements of the Brownian particles are summarized in his table on page 123 of Atoms, and this table is reproduced as Table 7.2 in Mayo's book on page 234. How good are these measurements? Let us try to represent the fit on the standardized normal curve, presuming that the errors are normally distributed. For this, we need to assume the true value of the Avogadro number; we choose two such values, 70 (multiplied by the 22th power of 10, as Perrin assumed from the kinetic theory at that time) and 60 (the contemporary value).
68.8
64
-1.2
-6
8.8
4
From the standard statistical calculations, we can represent the eight values in the following figures; standardized deviations are calculated and plotted on the normal curve. You can grasp the goodness of fit intuitively. The largest deviation in the top figure (true value is 70) is 0.692, and the largest deviation in the bottom figure (true value is 60) is 0.602. But taking a simple arithmetic mean, for example, of the 8 values, you can easily improve the accuracy.
Reference
Mayo, Deborah (1996) Error and the Growth of Experimental Knowledge, The University of Chicago Press.
Perrin, J. (1990) Atoms, Ox Bow Press (reprint).
Last modified Jan. 27, 2003. (c) Soshichi Uchii